Getting started
The bricks_from_* series of functions creates 3D models of LEGO bricks from a variety of input formats.
bricks_from_table() converts a matrix-shaped table of integers into LEGO bricks, where most columns are x-coordinates, rows are y-coordinates, and a special Level column denotes the elevation of the row. For simple models, this table can be made manually using data.frame() or tibble::tribble().
For more advanced models, it’s recommended you use MS Excel or a .csv file. bricks_from_excel() is a wrapper function to more easily build models designed using a Microsoft Excel template. Please see this repo: brickr toybox.
Pass the output of any bricks_from_*() function to build_bricks() to render it as a 3D model.
Individual bricks
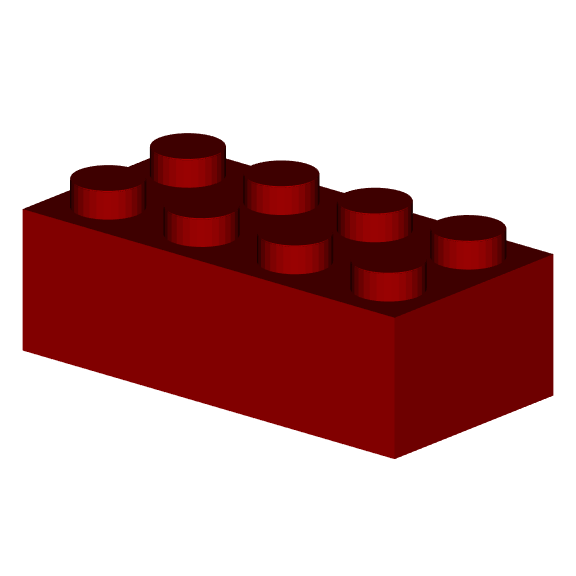
Create a single 2x4 brick with a 2x4 data frame, with an additional column to specify the ‘Level’. These can be letters or numbers.
#This is a 2 (columns) x 4 (rows) brick
(brick <- data.frame(
  Level="A",
  X1 = rep(3,4), #The number 3 is the brickrID for 'bright red'
  X2 = rep(3,4)
))
#>   Level X1 X2
#> 1     A  3  3
#> 2     A  3  3
#> 3     A  3  3
#> 4     A  3  3

brick %>%
  bricks_from_table() %>%
  build_bricks()

rgl::par3d(userMatrix = rgl::rotate3d(rgl::par3d("userMatrix"), 1.1*pi/4, 0, 0 ,1))
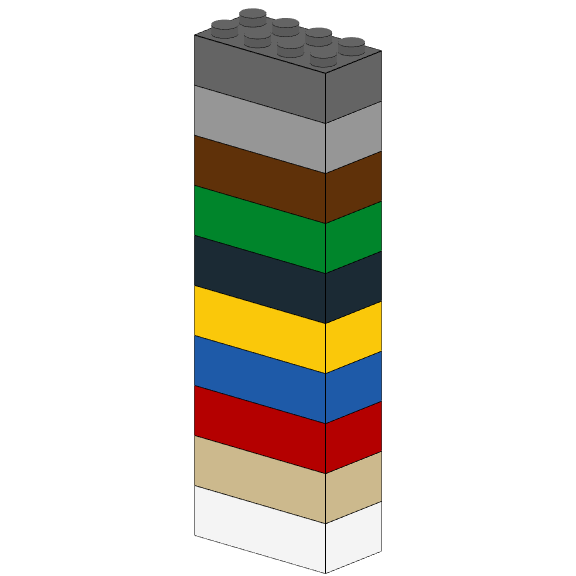
Stack many bricks by changing the ‘Level’ value in the data frame. The script below uses purrr::map_df() to avoid copying and pasting. Changing the numeric values inside the data frame for each level creates different colors.
1:10 %>%
  purrr::map_df(~dplyr::mutate(brick,
                        Level = LETTERS[.x],
                        X1 = .x,
                        X2 = .x)) %>%
  bricks_from_table() %>%
  build_bricks(rgl_lit=FALSE, outline_bricks = TRUE)

rgl::par3d(userMatrix = rgl::rotate3d(rgl::par3d("userMatrix"), 1.1*pi/4, 0, 0 ,1))
Full models
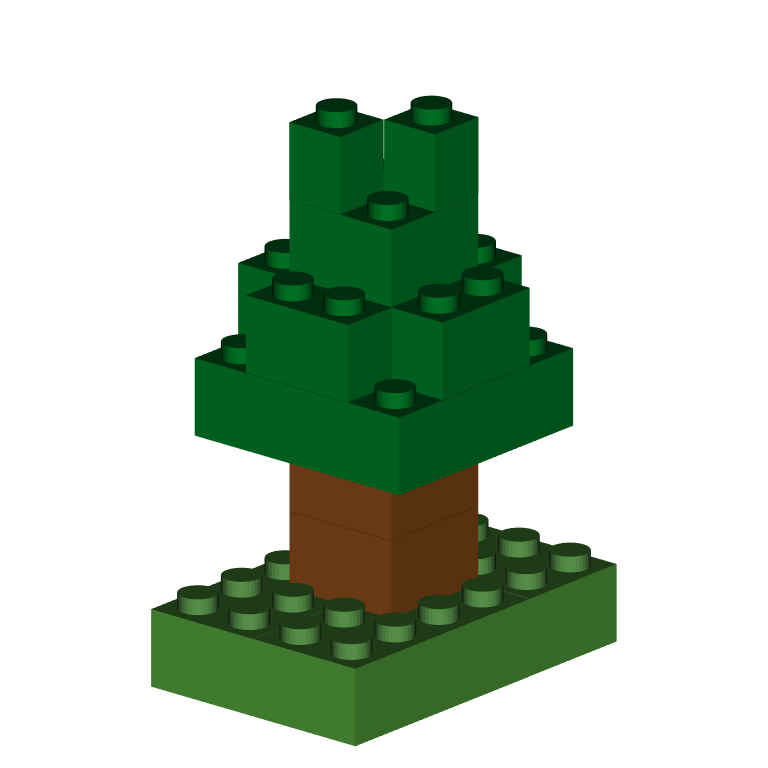
The most direct way to create a 3D model is to manually create a data frame. Below, we create a data frame using tibble::tribble() so we can more easily see the structure as it’s written.
The data frame has 3 numbers as input (values of 0 are void spaces in the model). Rather than use the default brickr colors for the values of 1, 2, and 3, we define another data frame ‘brick_colors’
tree_or_mushroom <- tibble::tribble(
  ~Level, ~X1, ~X2, ~X3, ~X4, ~X5, ~X6,
  "A", 1, 1, 1, 1, 1, 1,
  "A", 1, 1, 1, 1, 1, 1,
  "A", 1, 1, 1, 1, 1, 1,
  "A", 1, 1, 1, 1, 1, 1,
  "B", 0, 0, 0, 0, 0, 0,
  "B", 0, 0, 2, 2, 0, 0,
  "B", 0, 0, 2, 2, 0, 0,
  "B", 0, 0, 0, 0, 0, 0,
  "C", 0, 0, 0, 0, 0, 0,
  "C", 0, 0, 2, 2, 0, 0,
  "C", 0, 0, 2, 2, 0, 0,
  "C", 0, 0, 0, 0, 0, 0,
  "D", 0, 3, 3, 3, 3, 0,
  "D", 0, 3, 3, 3, 3, 0,
  "D", 0, 3, 3, 3, 3, 0,
  "D", 0, 3, 3, 3, 3, 0,
  "E", 0, 0, 3, 3, 0, 0,
  "E", 0, 3, 3, 3, 3, 0,
  "E", 0, 3, 3, 3, 3, 0,
  "E", 0, 0, 3, 3, 0, 0,
  "F", 0, 0, 0, 0, 0, 0,
  "F", 0, 0, 3, 3, 0, 0,
  "F", 0, 0, 3, 3, 0, 0,
  "F", 0, 0, 0, 0, 0, 0,
  "G", 0, 0, 0, 0, 0, 0,
  "G", 0, 0, 3, 0, 0, 0,
  "G", 0, 0, 0, 3, 0, 0,
  "G", 0, 0, 0, 0, 0, 0
)

brick_colors <- tibble::tribble(
  ~`.value`, ~Color,
  1, "Bright green",
  2, "Dark orange",
  3, "Dark green"
)

tree_or_mushroom %>%
  bricks_from_table(brick_colors) %>%
  build_bricks()

rgl::par3d(userMatrix = rgl::rotate3d(rgl::par3d("userMatrix"), 1.1*pi/4, 0, 0 ,1))
Bricks from Excel
When designing larger models, it is much easier to use a spreadsheet program to lay out the bricks for each level.
See the brickr toybox GitHub repo for some examples and templates.