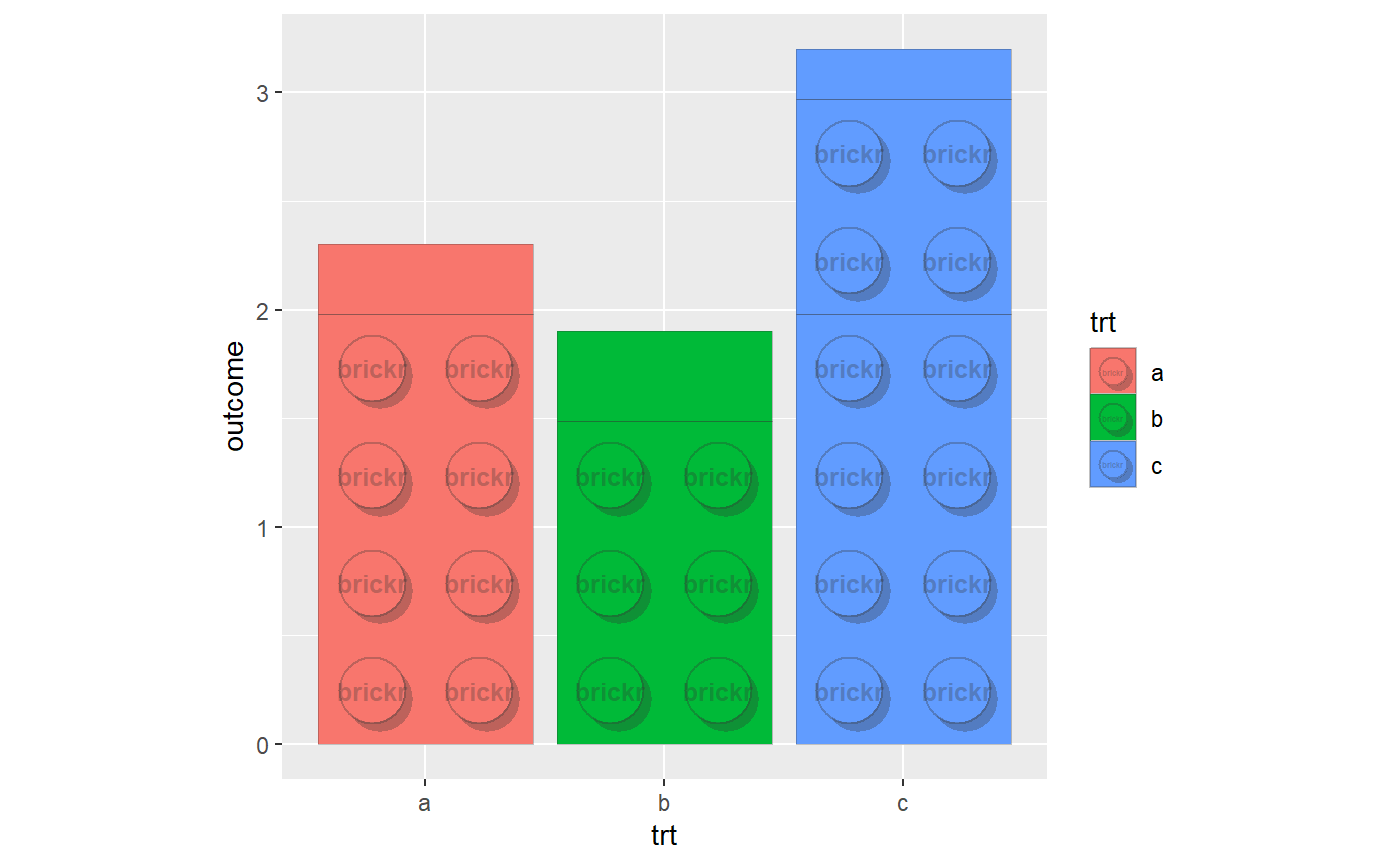
A fixed scale coordinate system that ensures correct brick proportions are maintained regardless of device size.
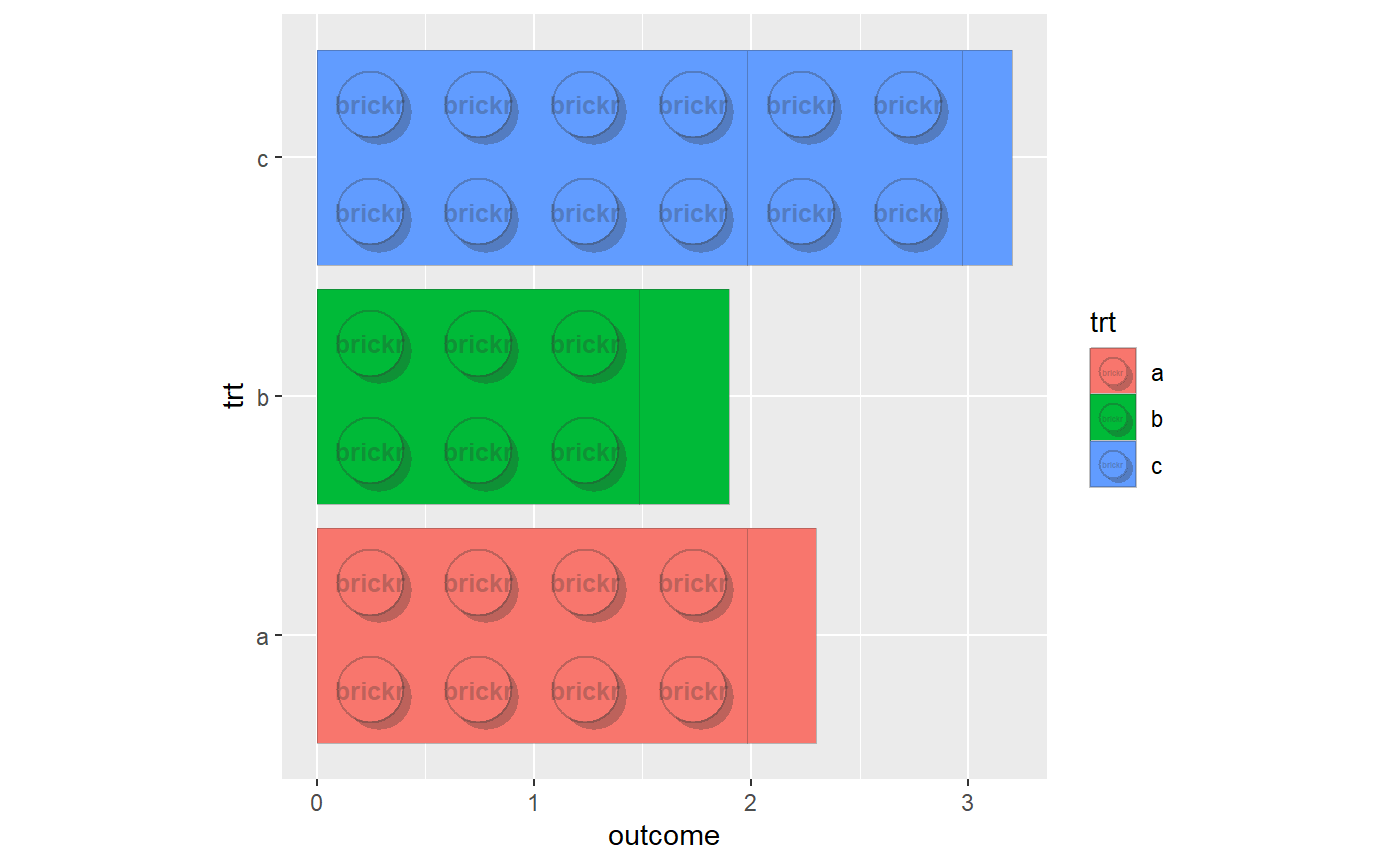
Use coord_brick_flip() for horizontal bars.
coord_brick(xlim = NULL, ylim = NULL, expand = TRUE, clip = "on")

coord_brick_flip(xlim = NULL, ylim = NULL, expand = TRUE,
  clip = "on")
Arguments
| xlim | Limits for the x and y axes. |
|---|---|
| ylim | Limits for the x and y axes. |
| expand | If |
| clip | Should drawing be clipped to the extent of the plot panel? A
setting of |
See also
Other Graphs: geom_brick_col,
geom_brick_rect,
scale_fill_brick, theme_brick
Examples
#geom_brick_col should be used in conjunction with other brickr charting #functions, especially coord_brick. df <- data.frame(trt = c("a", "b", "c"), outcome = c(2.3, 1.9, 3.2)) ggplot(df, aes(trt, outcome)) + geom_brick_col(aes(fill = trt)) + coord_brick()#horizontal bars ggplot(df, aes(trt, outcome)) + geom_brick_col(aes(fill = trt)) + coord_brick_flip()