Getting started
brickr includes functions to render ggplot2 bar charts as bricks with LEGO color themes. The main function is geom_brick_col(), which is the brickr equivalent of geom_col(). Additional functions are highly recommended to ensure that proper the chart is rendered in the proper functions and proportions.
df <- data.frame(trt = c("a", "b", "c"), outcome = c(2.3, 1.9, 3.2))

#For official LEGO colors, use with scale_fill_brick and theme_brick.
ggplot(df, aes(trt, outcome)) +
  geom_brick_col(aes(fill = trt)) +
  scale_fill_brick() +
  coord_brick() +
  theme_brick()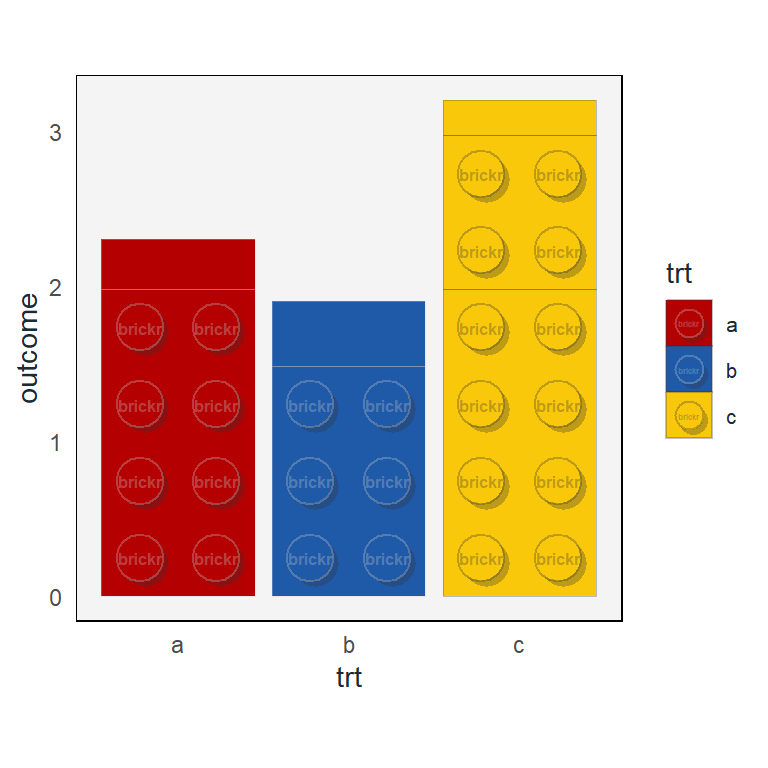
-
geom_brick_col()draws data columns as bricks. -
scale_fill_brick()is a discrete color scales, rendering columns in LEGO brick colors. -
coord_brick()fixes the ratio between brick width and height. Any excess height is rendered as a residual brick without knobs. -
theme_brick()is a modified version ofggplot2::theme_minimal().
See sections below for full detail.
Geoms
geom_brick_col()
Column / bar charts are rendered using the same structure as ggplot2::geom_col(), with a few additional inputs.
-
two_knob = TRUE(the default) renders columns with a width two LEGO knobs, generating 2x4, 2x3, 2x2, and 2x1 knob bricks. Set toFALSEfor columns with a width of 1 knob. This is useful when the chart has many columns and you don’t want to lose brick detail. -
split_bricks = TRUEbreaks columns into individual bricks, up to 4 knobs in length, as well as a residual brick at the top. Set this toFALSEto remove the splits, while retaining the knobs. *min_radius_for_textspecifies the lower bound of knob radius (as a percent of the plot view port) required to display the embossed text inside the knobs. This ensures the plot looks clean when there are many columns. Defaults to 0.02. -
labelis the text to display inside the brick knobs. A maximum of six characters. -
label_scalehelps to ensure that the text size of the label fits within the knob circumference. When the graphical device is rendered, brickr makes a best guess on the size of the text. This isn’t always the most aesthetic guess, so uselabel_scalevalues to adjust the size. Values >1 will increase the size proportional, while values <1 will decrease the size.-
Important This best guess is calculated in the initial rendering of the chart, so the text will NOT increase in size when using the zoom feature in RStudio. To share charts, it’s best to use
ggsave()rather than screen shots.
-
Important This best guess is calculated in the initial rendering of the chart, so the text will NOT increase in size when using the zoom feature in RStudio. To share charts, it’s best to use
df <- data.frame(x = LETTERS[1:10], y = sample(2:10, 10, replace = TRUE))

#For official LEGO colors, use with scale_fill_brick and theme_brick.
ggplot(df, aes(x, y)) +
  geom_brick_col(aes(fill = x), two_knob = FALSE, label = "LEGO", label_scale = 0.9) +
  scale_fill_brick() +
  coord_brick() +
  theme_brick()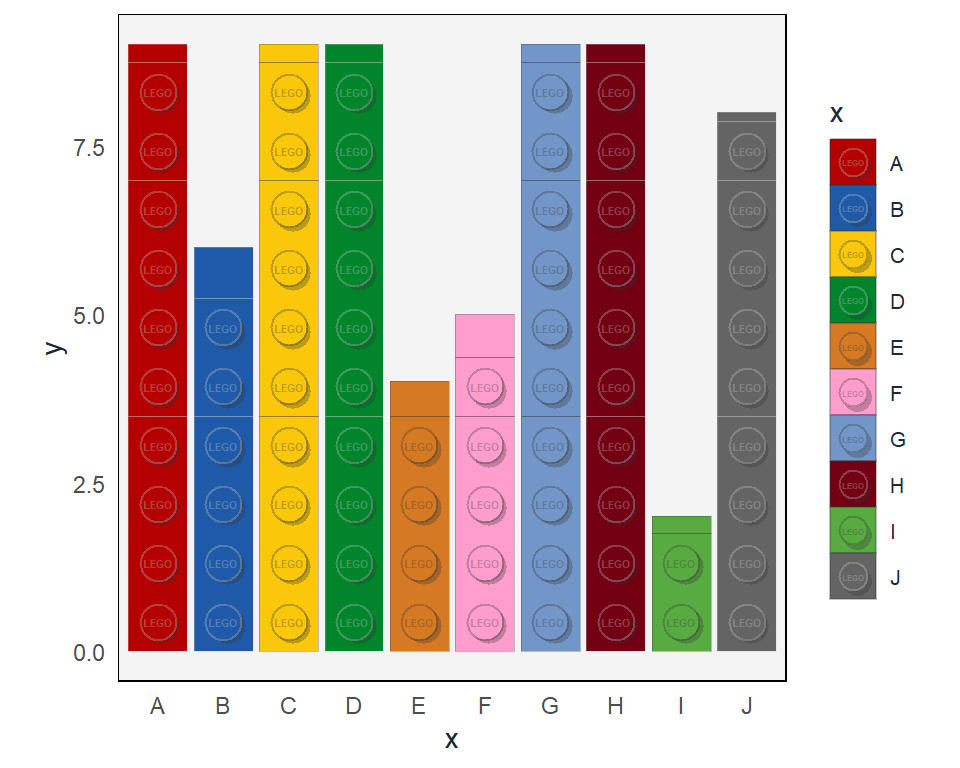
Coords
Using coord_brick() ensures that bricks are rendered with correct proportions. Unlike other coord_* functions in ggplot, no other inputs are necessary.
For horizontal bars, use coord_brick_flip().
df <- data.frame(x = LETTERS[1:8], y = sample(2:10, 8, replace = TRUE))

ggplot(df, aes(x, y)) +
  geom_brick_col(aes(fill = x), two_knob = FALSE) +
  scale_fill_brick() +
  coord_brick_flip() +
  theme_brick() +
  theme(legend.position = "none")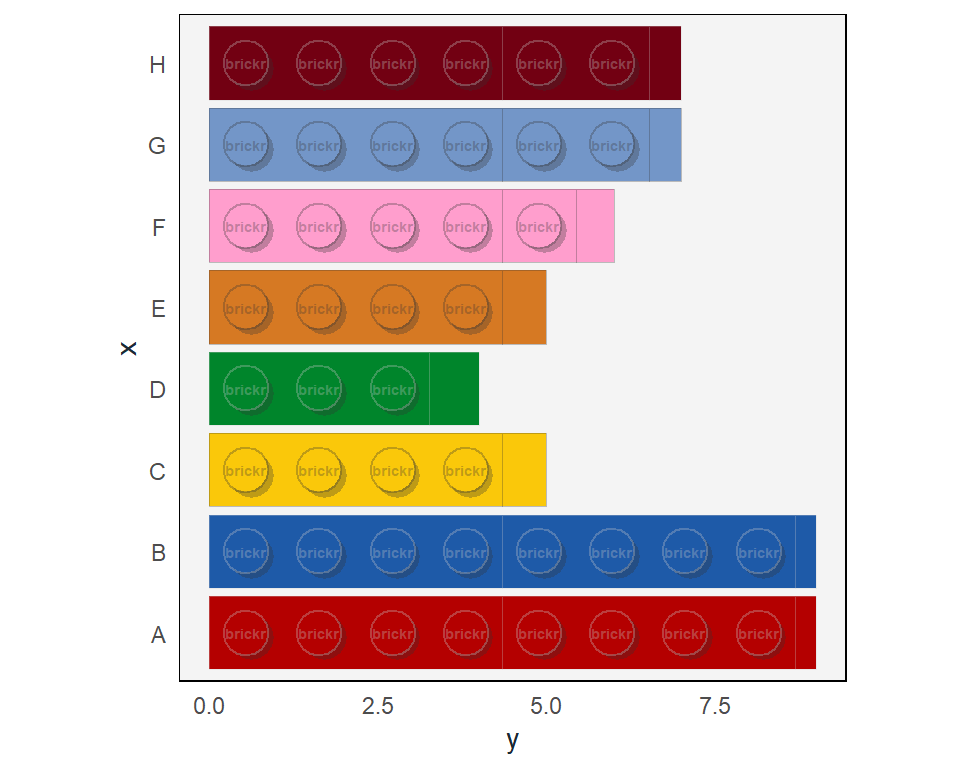
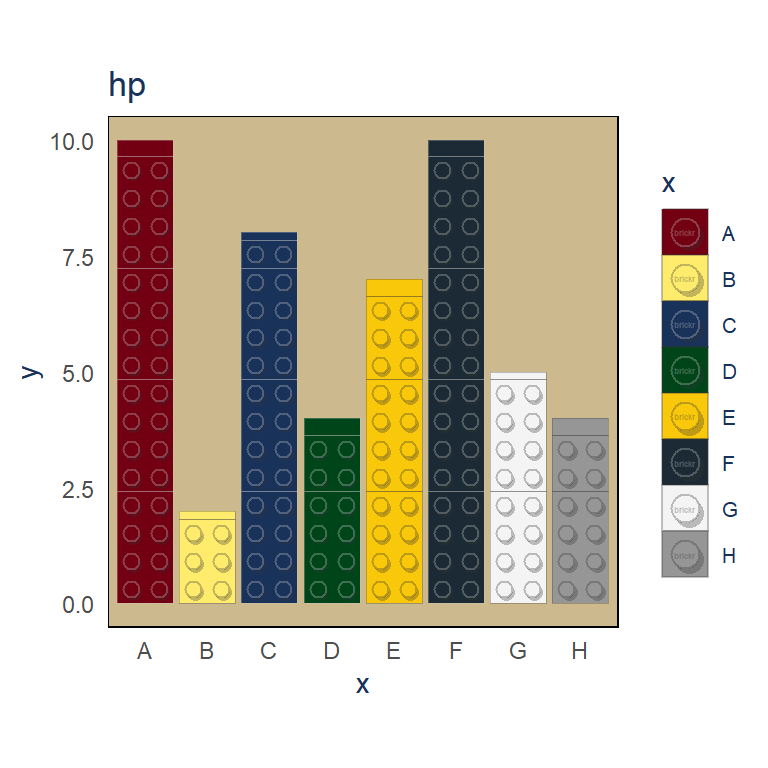
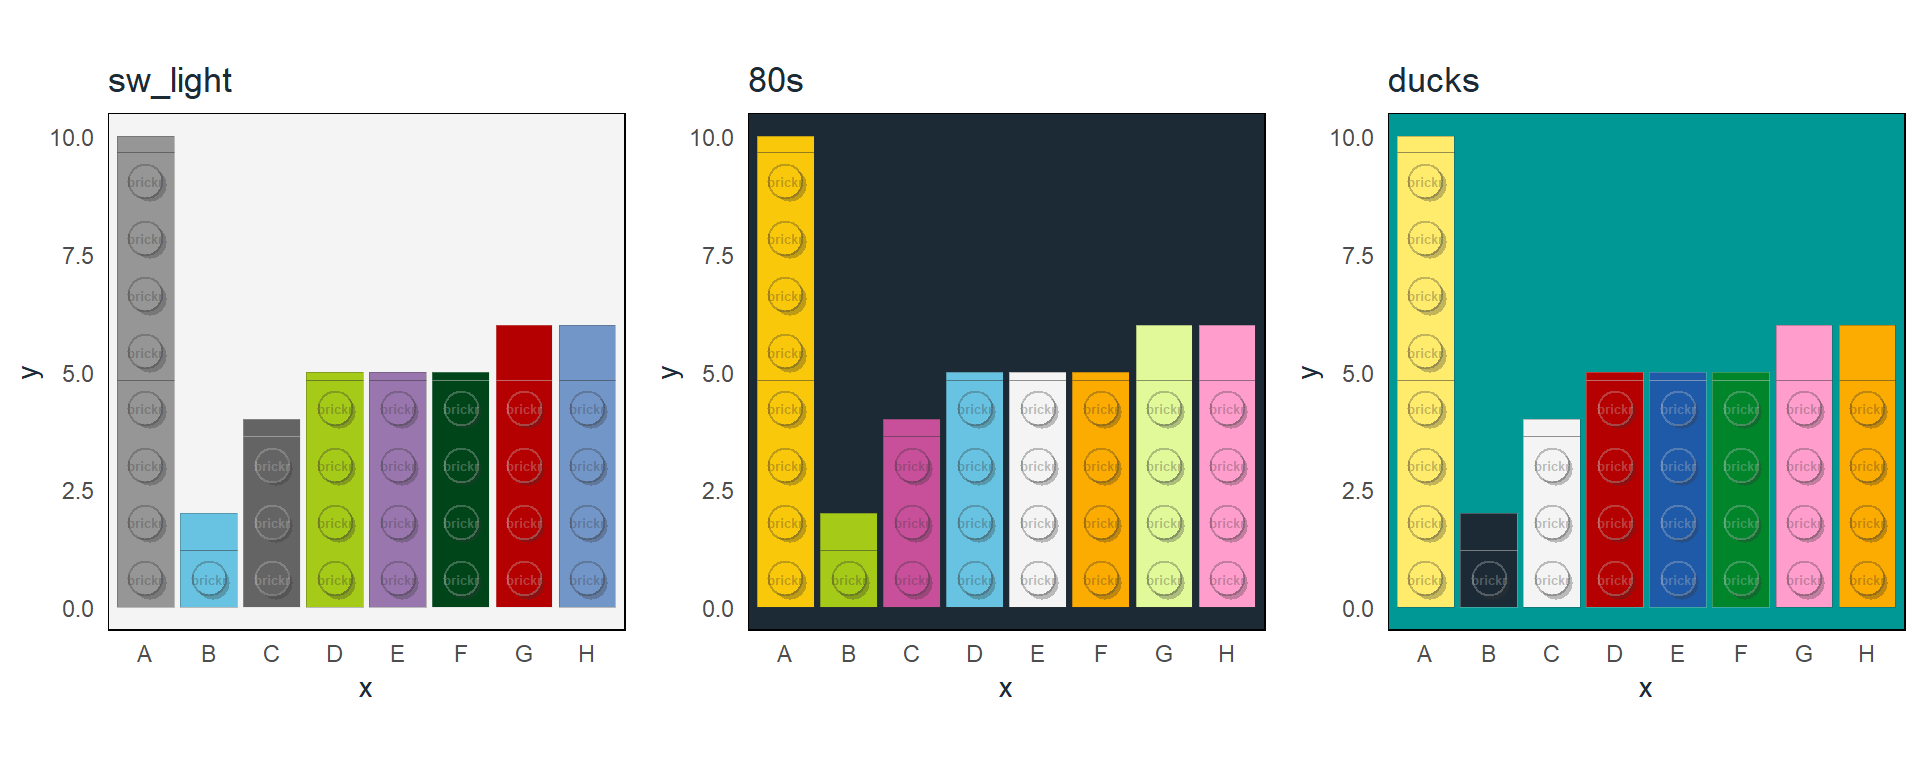
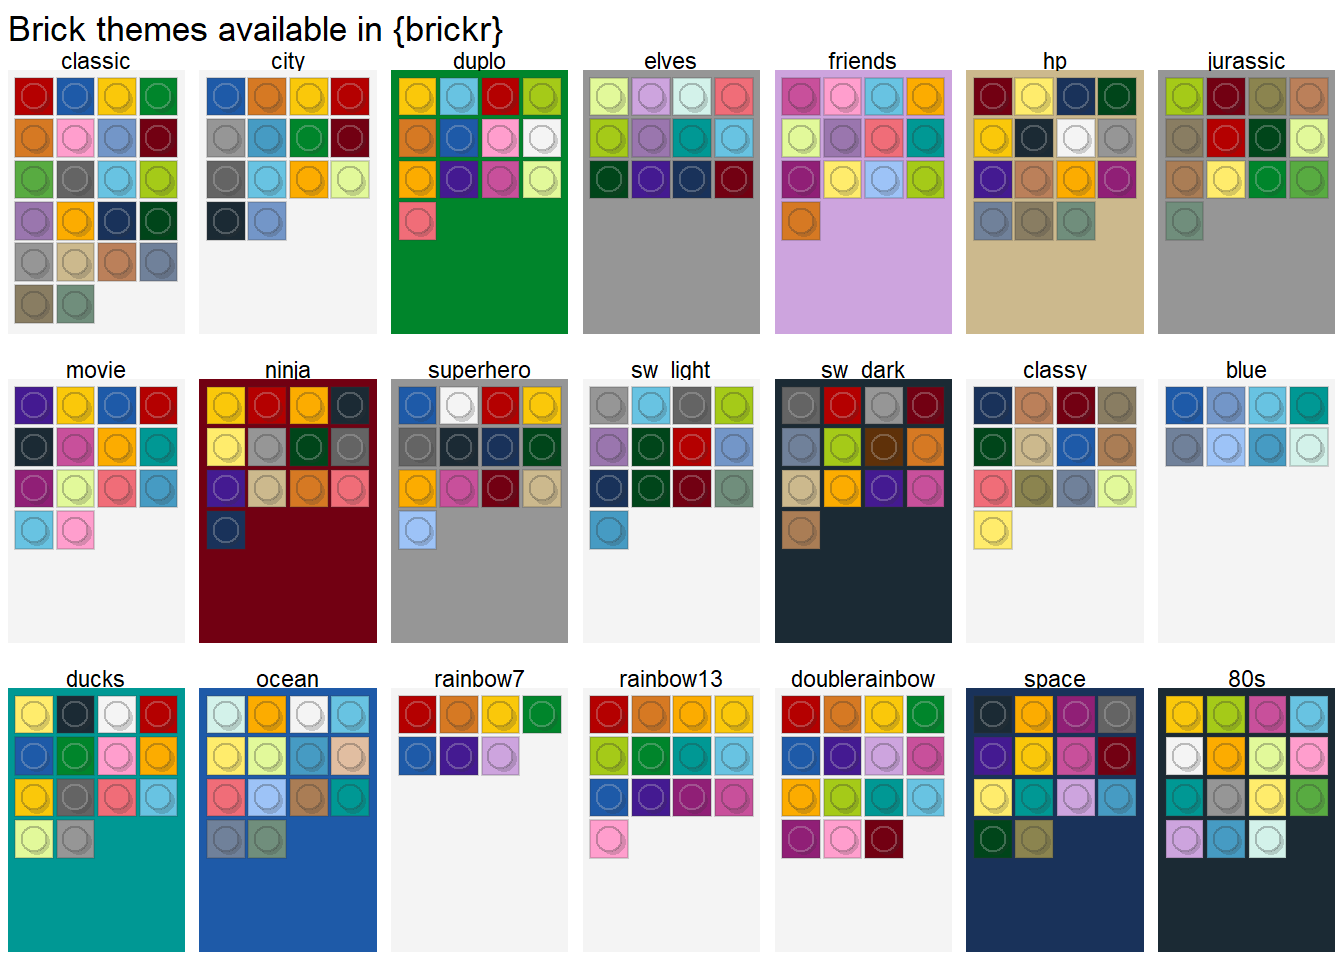
Scale and themes
There are 41 LEGO brick colors available in brickr. See build_colors() or View(lego_colors) for the complete list. The easiest way to use theme colors with plots are the scale_fill_brick() and the theme_brick() functions.
These functions default to using the ‘classic’ LEGO color theme, but can take any of the 21 themes included in brickr.